
Linear Model I – The Simple Linear Regression
Introduction
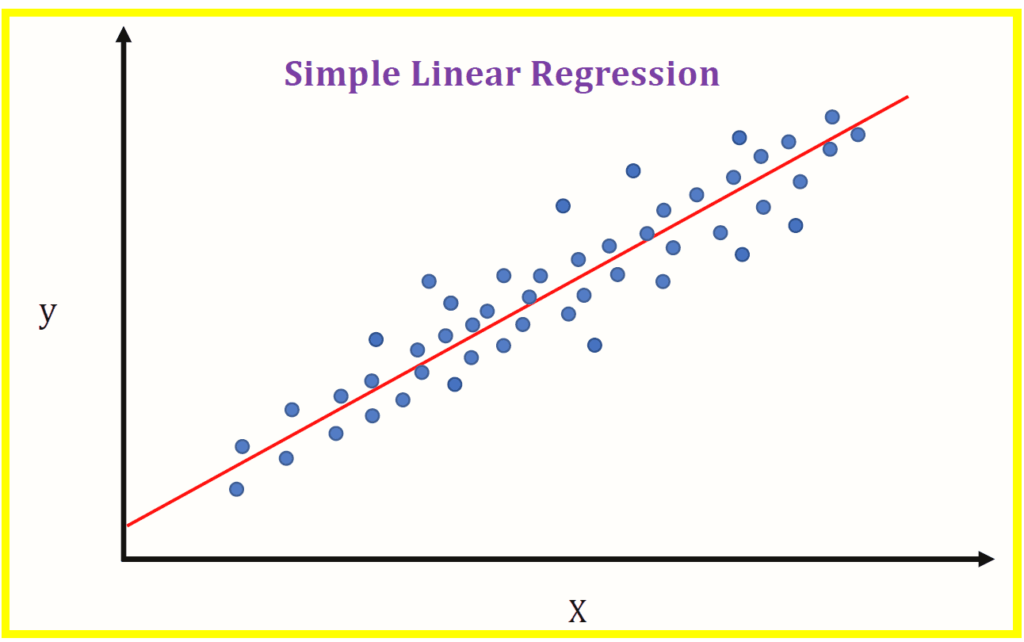
A linear model is a simple line that can be used to predict the value of a dependent variable. The linear regression is used for estimating the parameters of this line by minimizing the sum of squared errors. This tutorial describes how to interpret and understand the results of a simple linear regression.
What is a linear model?
A linear model is an equation that describes the relationship between a dependent variable and one or more independent variables. Linear models are used to predict outcomes, explain the relationship between two variables and make other predictions about how a process will behave.
Linear regression is one type of linear model with many applications in business, economics and statistics. In this tutorial we will learn how to use simple linear regression to predict values for new data points based on historical observations of those same data points
How to find the line of best fit using the least squares method.
The least squares method is a way of finding the line of best fit. The line of best fit is the line that minimizes the sum of squared errors, which is simply the difference between your actual values and predicted values. In other words, we want to find a straight line that explains as much variation in y as possible while minimizing error (or variance).
Assumptions of linear regression.
-
Linearity of the relationship: The relationship between x and y should be linear. If this assumption is violated, you can transform your data to make it linear (for example, by taking logs or square roots).
-
Constant variance: The variance of each error term must be constant over all values of x. If this assumption is violated, then you may need to transform your data in order to make it meet this condition (for example by taking logs).
-
Independence of errors: It’s important that each observation has its own independent error term; otherwise there could be autocorrelation between errors (which would lead to biased parameter estimates). You’ll need some way of ensuring independence between observations if they’re not truly independent (e.g., using student ID numbers or random numbers).
Interpretation of a simple linear regression.
The line of best fit is the line that minimizes the sum of the squared errors.
The slope of a simple linear regression can be interpreted as follows: The correlation coefficient measures how closely pairs of observations are related in terms of their vertical positions on a scatter plot; it’s equal to twice the average change in Y for every unit increase in X, divided by their standard deviation. A perfect positive correlation would have r = +1 (meaning that there is no deviation from linearity) and an r = -1 would indicate a perfect negative correlation (an inverse relationship). An r value close to zero indicates little or no linear relationship between X and Y, while an r value close to 1 indicates strong positive linearity (or negative).
Conclusion
In this tutorial, we have discussed the basics of linear regression. We started with describing what it is and why it’s used, before moving on to how you can find the line of best fit using least squares method. We then went on to discuss some assumptions that need to be met before running a linear regression analysis as well as how they affect your results. Finally, we looked at how interpreting these results can help us understand if there really is any relationship between two variables or not (and if so what kind).
Check out my behnace or my portfolio for examples.